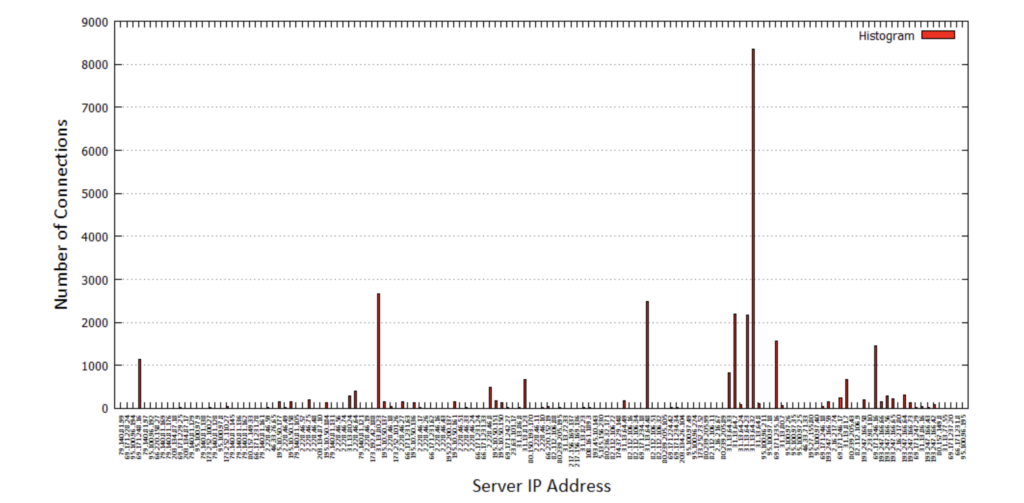
1.1. Produce a histogram that counts, for each server IP address, the number of connections whose client is “local”, uses HTTP as L-7 protocol and are directed to “*.facebook.com”
The output of using this script is shown:
{if(NR!=1){if ($99==1&&$101==1&&$115~/facebook.com/) {#histogram of server IP Address
hist[$45]++
#FQDN
fqdn[$45]=$115
##total count
count++}
}}
END {
{print “Server_IP_Address” ,”Number_of_Connections”, “Fraction”,”Percentage”, “FQDN” } for (x in hist)
{print x, hist[x], hist[x]/count, hist[x]/count*100, fqdn[x]}
}
The command needed to achieve the objective is:
farhan@ubuntu:~/Desktop$ zcat log_tcp_complete.gz | awk -f 4_5.awk | column -t > 4_5.txt
The plot using gnuplot is shown below:
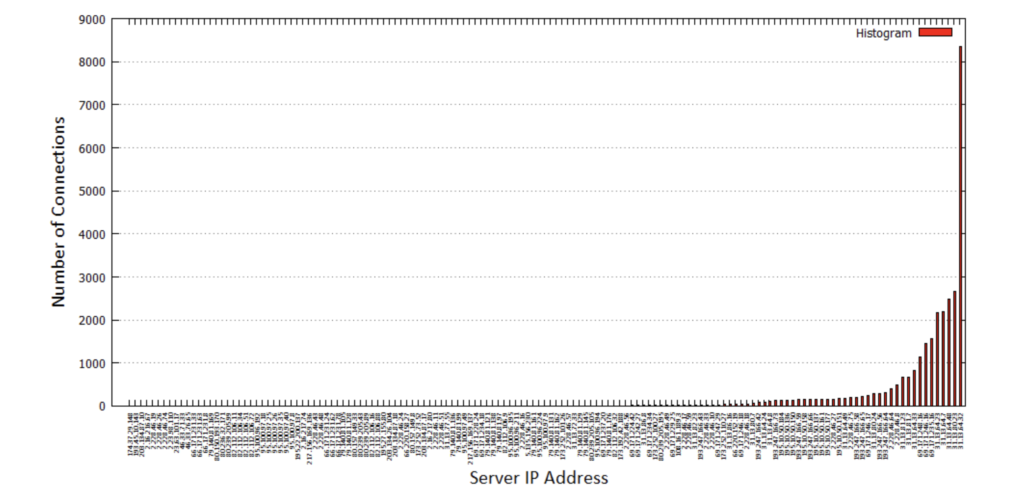
As above, but sort the results in increasing number of flows and plot the result using a histogram.
For this, the command needed is:
farhan@ubuntu:~/Desktop$ zcat log_tcp_complete.gz | awk -f 4_5.awk | column –t | sort –n –k2 > 4_5.txt
The plot of the histogram is produced here:
1.2. What are the top ten most used “services” in general? (Consider the name in column 114 as “service”).
The awk script used here is:
{if(NR!=1){fqdn[$115]++}}
END {
for (x in fqdn)
{print x, fqdn[x]}
}
The output of using this script is shown:
farhan@ubuntu:~/Desktop$ zcat log_tcp_complete.gz | awk -f 5_2.awk | column -t | sort -n –
k2 | tail -n 10 ib.adnxs.com fb1.farm2.zynga.com star.c10r.facebook.com www.google.com fbstatic-a.akamaihd.net graph.facebook.com fbcdn-profile-a.akamaihd.net profile.ak.fbcdn.net www.facebook.com
–
11535
11744
13824
13837
14809
15832
20742
20851
21612
1040077
So the most used service has the FQDN: “-“, which means unknown, this can include protocols other than HTTP. Other most used services include Facebook, Facebook CDN Akamai, Google, Zynga Farmville, and “ib.adnxs.com” which looks like some ad service.
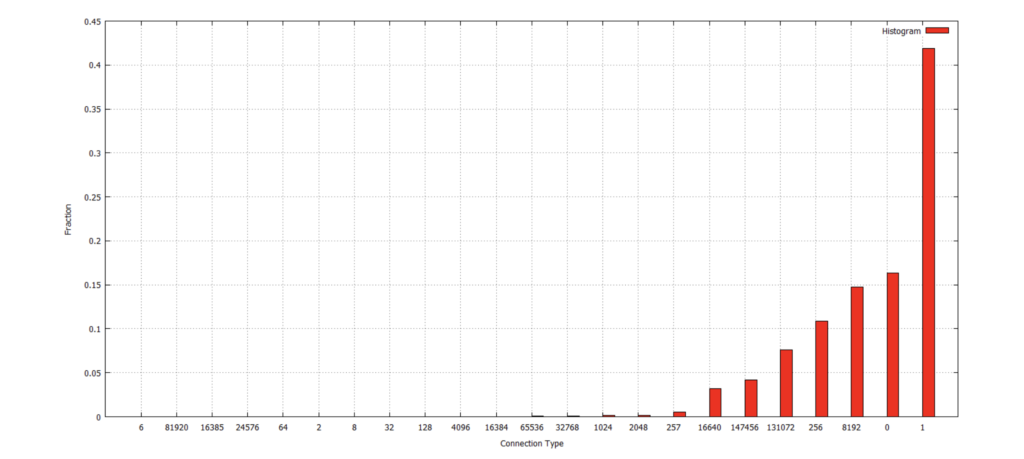
1.3. Write a script that counts the fraction of connections for “connection type” and then plot the results over time.
The awk script used here is:
{if(NR!=1){conntype[$101]++ count++}} END {
{
for (x in conntype)
{print x, conntype[x], conntype[x]/count} }
}
The script is used in this way:
farhan@ubuntu:~/Desktop$ zcat log_tcp_complete.gz | awk -f 5_3.awk | column -t | sort -n -k2 > 5_3_results.txt
Then the file of results is used to plot the histogram:
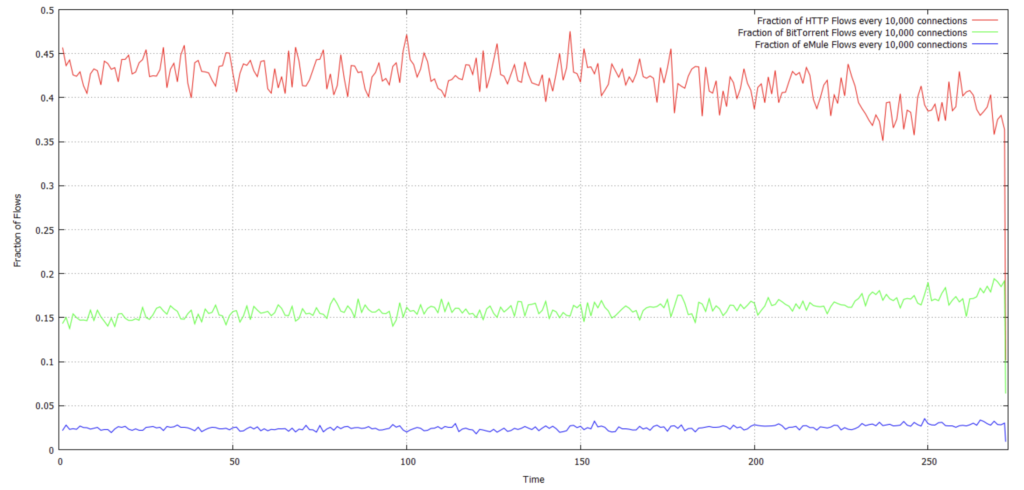
1.4. Write a script that counts the fraction of HTTP flows every 10,000 connections. Plot the results over time. Add a second line to the above plot that reports the fraction of BitTorrent connections over time. Add a third line with the number of eMule flows over time.
The awk script used here is:
{ if(NR!=1) {
if($101==1){count++} if($101==131072||($101==256&&$102==9)){count1++} if($101==16384||($101==256&&($102==1||$102==3))){count2++} if((NR-1)%10000==0)
{
http[NR-1]=count-lastcount; bittorrent[NR-1]=count1-lastcount1;
} }
emule[NR-1]=count2-lastcount2;
lastcount=count
lastcount1=count1
lastcount2=count2
}
END{
http[NR-1]=count-lastcount; bittorrent[NR-1]=count1-lastcount1; emule[NR-1]=count2-lastcount2;
print “Time” , “HTTP_Fraction” , “Bittorrent_Fraction” , “eMule_Fraction” for (t in http)
{print t/10000,http[t]/10000,bittorrent[t]/10000,emule[t]/10000}
}
#t is the time
The script is used in this way:
farhan@ubuntu:~/Desktop$ zcat log_tcp_complete.gz | awk -f 5_4.awk | sort -n -k1 > 5_4_results.txt
Then the file of results is used to plot the fraction of flows:
3.5. What is the next script doing? Try to understand it.
The script is shown here with the purpose of each command:
The output of this script is the following:
farhan@ubuntu:~/Desktop$ zcat log_tcp_complete.gz | head -n 1000000 | awk -f 5_7.awk |
column -t | sort -n -k2
number IP_address
1 74.125.209.22
1 74.125.213.246
1 74.125.214.180
1 74.125.214.208
1 74.125.215.81
1 74.125.216.112
1 74.125.218.181
1 173.194.2.13
2 208.117.245.164
2 208.117.245.230
1 208.65.155.18
29 208.65.154.142
names ,v7.cache1.c.youtube.com ,v7.cache8.c.youtube.com ,v5.cache6.c.youtube.com ,v1.cache7.c.youtube.com ,v2.cache3.c.youtube.com ,v1.cache4.c.youtube.com ,v6.cache6.c.youtube.com ,v17.lscache1.c.youtube.com ,tc.v23.cache4.c.youtube.com ,tc.v16.cache8.c.youtube.com ,tc.v11.cache1.c.youtube.com ,tc.v23.cache4.c.youtube.com