Tracking VPN User Inactivity in FortiAnalyzer

Have you ever wondered which VPN users are holding onto active permissions without actually using them for weeks or months? Monitoring user inactivity is essential for compliance and security audits, and with a simple custom dataset, FortiAnalyzer can do the heavy lifting for you.

The Challenge: Visibility into Dormant Accounts Standard VPN reports often focus on who is connected, but they rarely highlight who has stopped connecting. To bridge this gap, we need to look at the “tunnel-up” events over a historical period and calculate the delta between the last connection and the current date.

Step 1: Create the Custom Dataset

The heart of this report is the Dataset. This is where we tell FortiAnalyzer to look at “tunnel-up” events and calculate the time difference between the last login and today.

  • Log in to your FortiAnalyzer.
  • Navigate to Reports > Report Definitions > Datasets.
  • Click Create New.
  • Set the Log Type to Event.
  • Paste the following SQL query:
SELECT
  COALESCE(
    NULLIF(NULLIF(NULLIF(t.xauthuser, 'N/A'), 'n/a'), ''),
    NULLIF(NULLIF(NULLIF(t.user, 'N/A'), 'n/a'), ''),
    ipstr(t.remip)
  ) AS ipsec_user_id,
  t.vpntunnel,
  t.last_vpn_connect_time,
  t.days_inactive
FROM
  (
    SELECT
      xauthuser,
      user,
      remip,
      vpntunnel,
      MAX(itime) AS max_itime_raw,
      formatDateTime(MAX(itime), '%Y-%m-%d %H:%i:%S') AS last_vpn_connect_time,
      dateDiff('day', MAX(itime), NOW()) AS days_inactive
    FROM
      $log
    WHERE
      $filter
      AND (
        xauthuser IS NOT NULL
        OR user IS NOT NULL
      )
      AND subtype = 'vpn'
      AND action = 'tunnel-up'
    GROUP BY
      xauthuser,
      user,
      remip,
      vpntunnel
    HAVING
      MAX(itime) < NOW() - 1 * 24 * 60 * 60
  ) AS t
GROUP BY
  ipsec_user_id,
  t.vpntunnel,
  t.last_vpn_connect_time,
  t.days_inactive
ORDER BY
  LOWER(ipsec_user_id),
  t.days_inactive DESC,
  t.last_vpn_connect_time DESC

Note: On line 36, the 1 represents the number of days. If you want to find users inactive for more than 30 days, change this value to 30.

Step 2: Build the Chart

Once the dataset is ready, you need to turn it into a visual element:

  • Go to Reports > Report Definitions > Charts.
  • Click Create New.
  • Select the Dataset you created in Step 1.
  • Choose the Table chart type.
  • Add the columns: ipsec_user_id, vpntunnel, last_vpn_connect_time, and days_inactive.

Step 3: Generate the Report

Finally, add your chart to a report:

  • Navigate to Reports > Report Definitions > Reports.
  • Create a new report or edit an existing one.
  • Add your new Chart into the report layout.
  • In Report Settings, ensure you select the correct devices and a broad enough time range (e.g., “Last 30 Days” or “Last 90 Days”) to capture historical data.

The Result

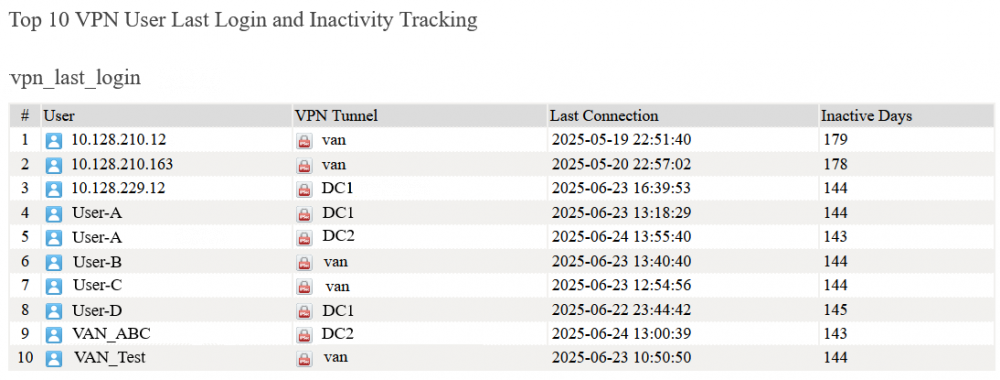
Your generated report will now show a clean list of User IDs, the specific VPN tunnel they used, their last connection timestamp, and exactly how many days they have been inactive.

This visibility allows you to proactively disable accounts that are no longer needed, reducing your attack surface and ensuring your VPN licenses are used efficiently.

vpn_inactivity


Related Documents:
Creating Dataset.
Creating Charts.
Creating reports without using a template.
Technical Tip: How to create a VPN report for users’ connection and disconnection time. 

Scroll to Top